
The weekly report, from live data.
A dashboard is a page of charts and figures built from the project's assets, issues, RFIs, reviews, scripts and trackers. Every widget renders live data when you open it, filters narrow the whole page, and the dashboard exports to PDF, Word or PowerPoint as you see it.
Available on
app.cx-assistant.com
What you can do
Charts, number cards, tables and progress bars
Each widget picks its data, the group-bys, the metrics and the filters, then its type: chart, number card, table, progress bar or text. The preview shows real project data while you build.
Ready-made analyses
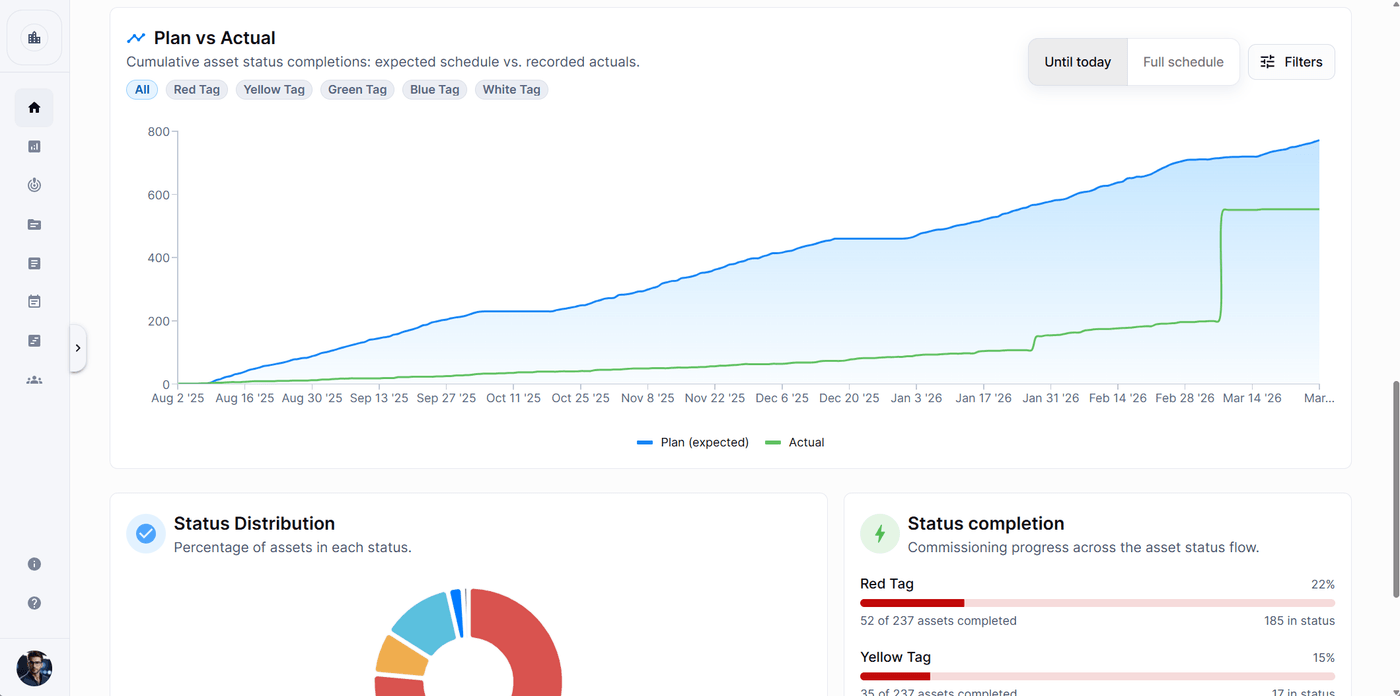
Issues created vs closed over time, asset plan vs actual sign-offs, a tracker's totals by status and document approval progress per group are available as templates with tunable settings.
Filters for the viewer
The author defines the filters at the top of the dashboard, time window first. They narrow every widget bound to them, and a badge counts the filters changed from their defaults.
Click a bar to see the records
Click a bar, a slice or a point on a line to list the records behind it inside the card, open any of them, or copy the list of IDs.
Export to PDF, Word or PowerPoint
The PDF keeps the grid, Word runs section by section, and PowerPoint makes one slide per section. All three start with the dashboard name, the project and the date, and carry the filters you had applied.
Built with the assistant
Describe the dashboard in a chat and the assistant creates it, adds and edits widgets, sets up the filters and previews each chart with your data before applying it.
How a team uses it
- 1
A project member creates a dashboard from a starter template, Project overview, Issues deep-dive, Delivery or My work, or starts blank.
- 2
Widgets are added to sections in the builder, or the assistant builds them from a description in chat.
- 3
The team opens the dashboard: each person sees live numbers computed with their own permissions, and My work widgets show each viewer their own items.
- 4
Before the weekly meeting, the filters are set to the period and the dashboard is exported to PowerPoint or Word.
In more detail
What the data covers
Issues, RFIs, assets, reviews, scripts and tracker rows, with their statuses, priorities, dates and assignees. Metrics include counts, average and median close time, cycle time, response time and open issues per asset.
Chart settings without the builder
A gear on each chart changes its shape, palette, colours per series, legend, grid lines and card height, and the change is saved for everyone a moment later.
Shared or private
A visibility switch decides whether a dashboard is shared with the project or only for you. Every viewer sees only data their own role can read.
Headline figures
A chart or table can show a big number under its title, such as the total and the percentage closed, computed from the same rows the chart draws.
The full guide, step by step
The same help the app shows, published here: every screen, every field, every permission.
Questions
Yes. Export as PDF, Word or PowerPoint from the dashboard. The file contains the sections, charts, number cards, tables, progress bars and text, with the filters you applied. In Word and PowerPoint the charts are pictures.
Not always. Each widget computes over data the viewer's role can read, and Assigned to me widgets show each person their own issues. Two colleagues can open the same dashboard and see different, correct numbers.
No. Click Build with AI on the Dashboards page or ask for a dashboard in any chat. The assistant creates it, adds and edits widgets and filters, and previews each chart with your data before applying it.
Ready to see your next project clearly?
Bring assets, issues, documents, and schedule into one place — and put an AI assistant that knows your project next to every engineer.
No credit card required · Web, mobile & Office